Edit chart
Loading graph
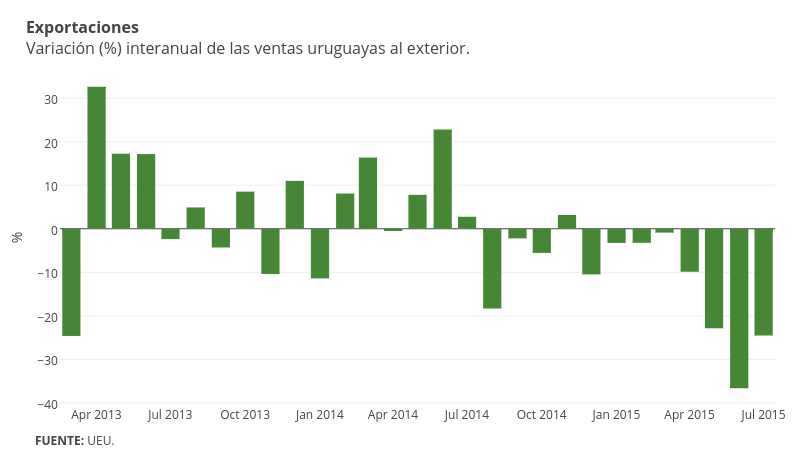
Emiliasalaverria's interactive graph and data of "% vs time" is a bar chart, showing Col2; with time in the x-axis and % in the y-axis.. The x-axis shows values from 1360893600000 to 1436929200000. The y-axis shows values from -40.465555555555554 to 36.44555555555556. This visualization has the following annotations: ExportacionesVariación (%) interanual de las ventas uruguayas al exterior.; FUENTE: UEU.