Edit chart
Loading graph
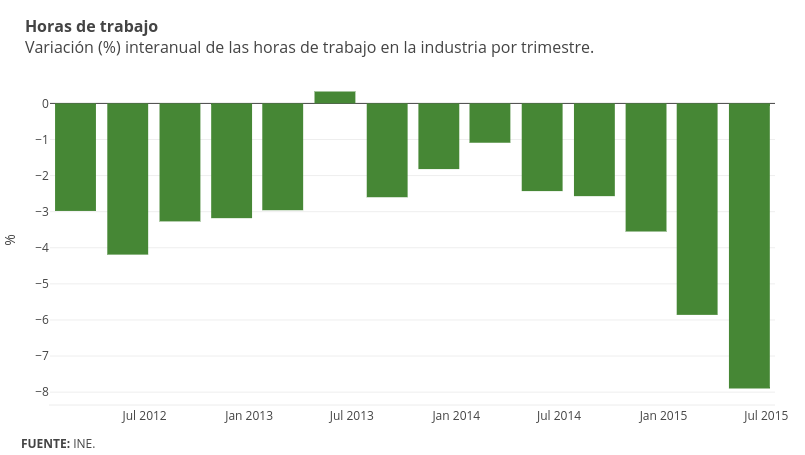
Emiliasalaverria's interactive graph and data of "% vs time" is a bar chart, showing Col2; with time in the x-axis and % in the y-axis.. The x-axis shows values from 1326679199999.993 to 1437015599999.9944. The y-axis shows values from -8.357222222222223 to 0.7872222222222223. This visualization has the following annotations: Horas de trabajo Variación (%) interanual de las horas de trabajo en la industria por trimestre.; FUENTE: INE.