Edit chart
Loading graph
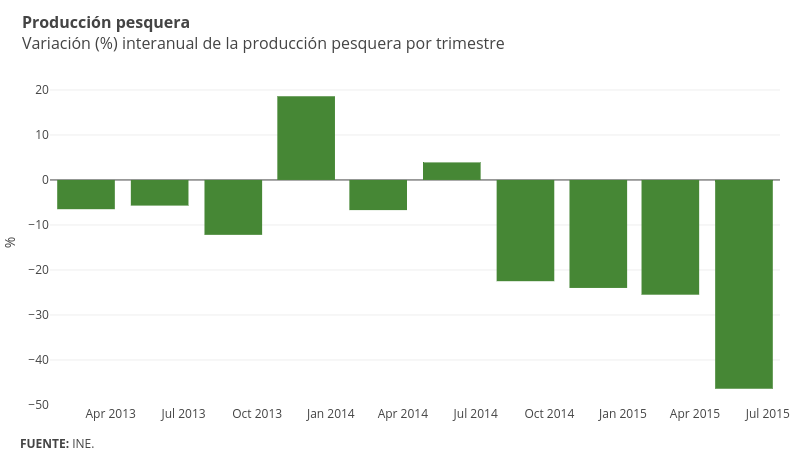
Emiliasalaverria's interactive graph and data of "% vs time" is a bar chart, showing Col2; with time in the x-axis and % in the y-axis.. The x-axis shows values from 1358215200000 to 1437015600000. The y-axis shows values from -50.011111111111106 to 22.211111111111112. This visualization has the following annotations: Producción pesqueraVariación (%) interanual de la producción pesquera por trimestre ; FUENTE: INE.