Edit chart
Loading graph
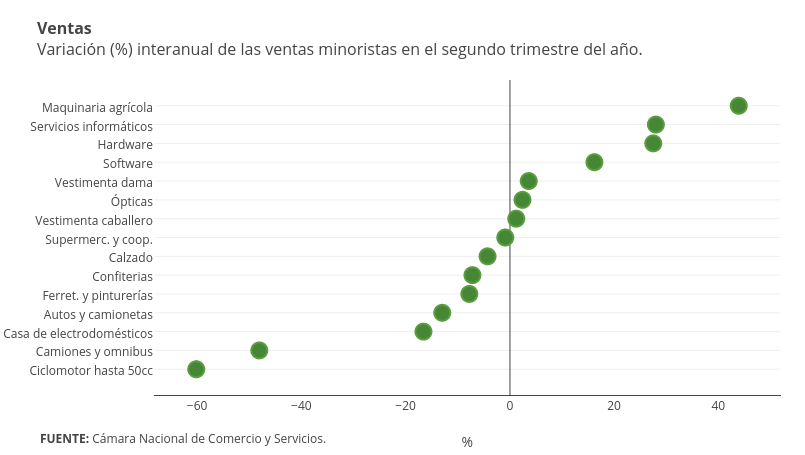
Emiliasalaverria's interactive graph and data of "Col1" is a scatter chart, showing Col1; with % in the x-axis. The x-axis shows values from -68.11543778801844 to 51.81543778801843. The y-axis shows values from -1.3681214421252372 to 15.368121442125236. This visualization has the following annotations: VentasVariación (%) interanual de las ventas minoristas en el segundo trimestre del año.; FUENTE: Cámara Nacional de Comercio y Servicios.