Edit chart
Loading graph
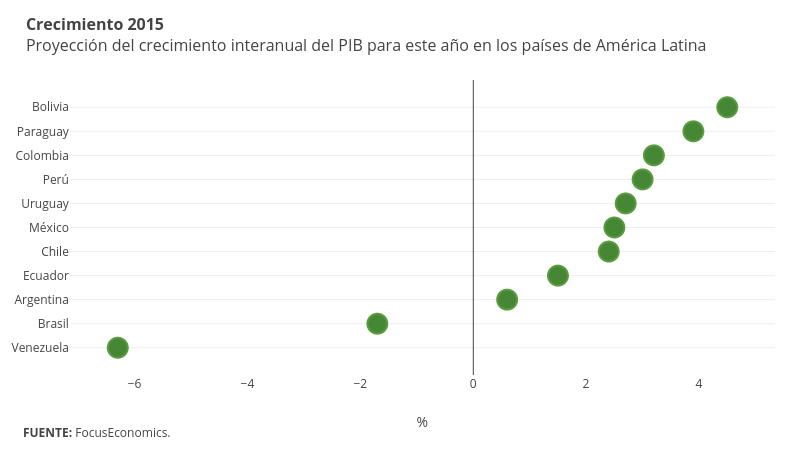
Emiliasalaverria's interactive graph and data of "Col1" is a scatter chart, showing Col1; with % in the x-axis. The x-axis shows values from -7.146103363412633 to 5.346103363412634. The y-axis shows values from -1.133056133056133 to 11.133056133056133. This visualization has the following annotations: Crecimiento 2015Proyección del crecimiento interanual del PIB para este año en los países de América Latina; FUENTE: FocusEconomics.