Edit chart
Loading graph
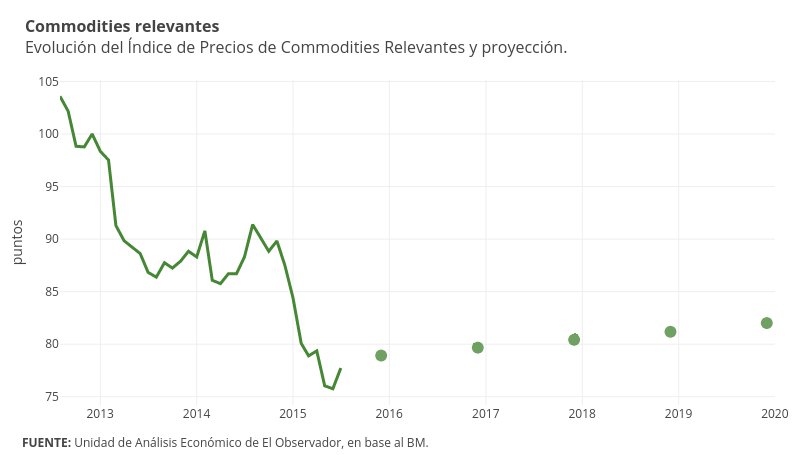
Emiliasalaverria's interactive graph and data of "puntos vs time" is a line chart, showing Col2 vs Col3; with time in the x-axis and puntos in the y-axis.. The x-axis shows values from 1343790000000 to 1577844000000. The y-axis shows values from 74.21388888888889 to 105.13611111111112. This visualization has the following annotations: Commodities relevantesEvolución del Índice de Precios de Commodities Relevantes y proyección.; FUENTE: Unidad de Análisis Económico de El Observador, en base al BM.