Edit chart
Loading graph
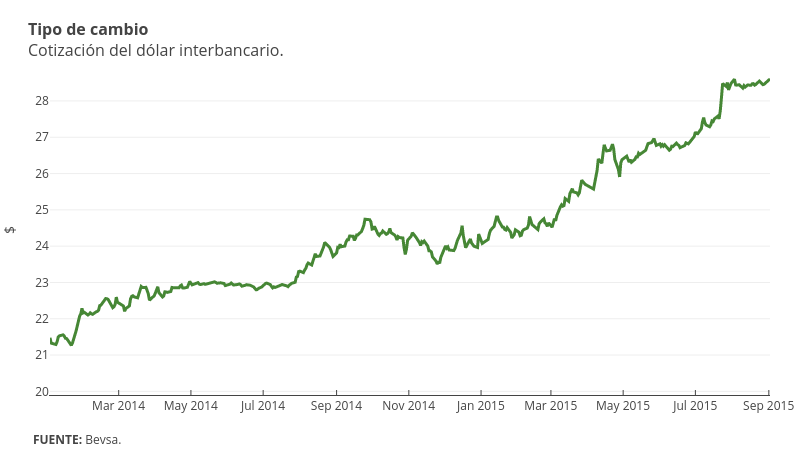
Emiliasalaverria's interactive graph and data of "$ vs time" is a scatter chart, showing Col2; with time in the x-axis and $ in the y-axis.. The x-axis shows values from 1388628000000 to 1441162800000. The y-axis shows values from 19.9 to 28.99. This visualization has the following annotations: Tipo de cambioCotización del dólar interbancario.; FUENTE: Bevsa.