Edit chart
Loading graph
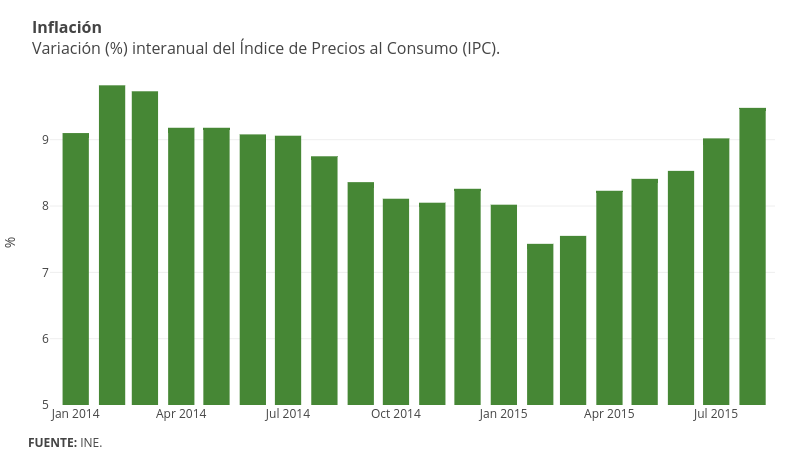
Emiliasalaverria's interactive graph and data of "% vs time" is a bar chart, showing Col2; with time in the x-axis and % in the y-axis.. The x-axis shows values from 1386640800000 to 1440039600000. The y-axis shows values from 5 to 9.9. This visualization has the following annotations: InflaciónVariación (%) interanual del Índice de Precios al Consumo (IPC).; FUENTE: INE.