Edit chart
Loading graph
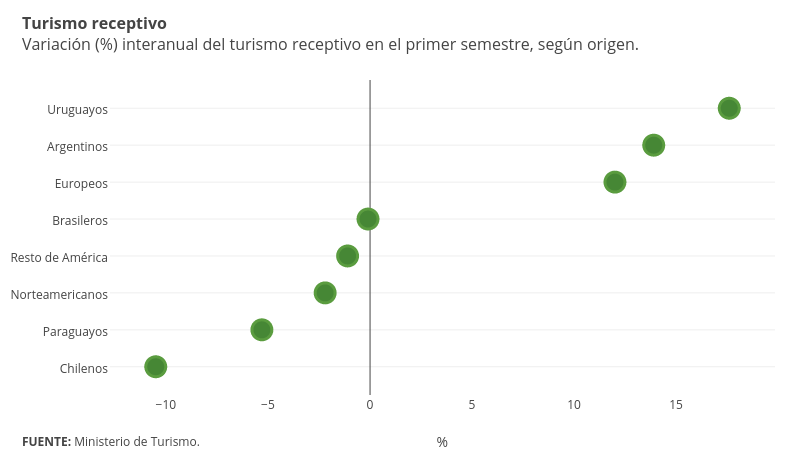
Emiliasalaverria's interactive graph and data of "Col1" is a scatter chart, showing Col1; with % in the x-axis. The x-axis shows values from -12.741630340017437 to 19.84163034001744. The y-axis shows values from -0.7649903288201161 to 7.764990328820116. This visualization has the following annotations: Turismo receptivo Variación (%) interanual del turismo receptivo en el primer semestre, según origen.; FUENTE: Ministerio de Turismo.