Edit chart
Loading graph
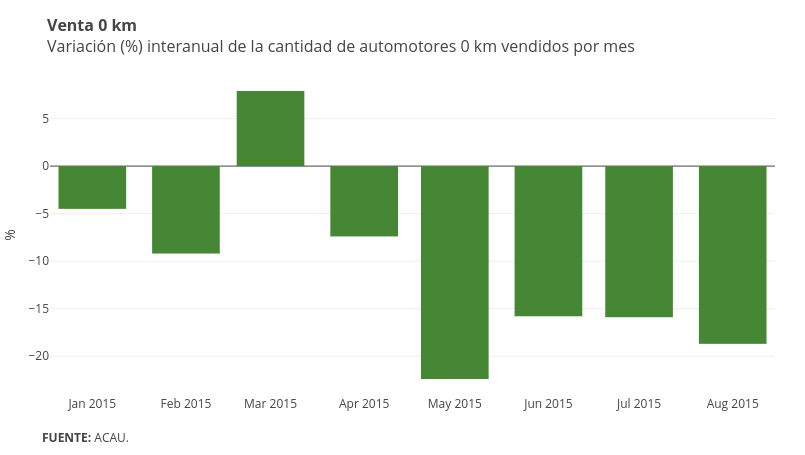
Emiliasalaverria's interactive graph and data of "% vs time" is a bar chart, showing Col2; with time in the x-axis and % in the y-axis.. The x-axis shows values from 1418868000000 to 1439607600000. The y-axis shows values from -24.083333333333332 to 9.583333333333334. This visualization has the following annotations: Venta 0 kmVariación (%) interanual de la cantidad de automotores 0 km vendidos por mes; FUENTE: ACAU.