Edit chart
Loading graph
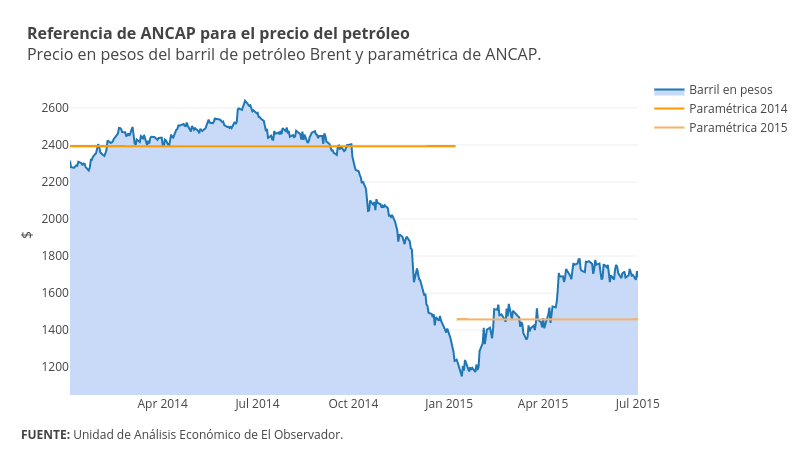
Emiliasalaverria's interactive graph and data of "$ vs time" is a filled line chart, showing Barril en pesos, Paramétrica 2014, Paramétrica 2015; with time in the x-axis and $ in the y-axis.. The x-axis shows values from 1388628000000 to 1435719600000. The y-axis shows values from 1050 to 2777.263157894737. This visualization has the following annotations: Referencia de ANCAP para el precio del petróleoPrecio en pesos del barril de petróleo Brent y paramétrica de ANCAP.; FUENTE: Unidad de Análisis Económico de El Observador.