Edit chart
Loading graph
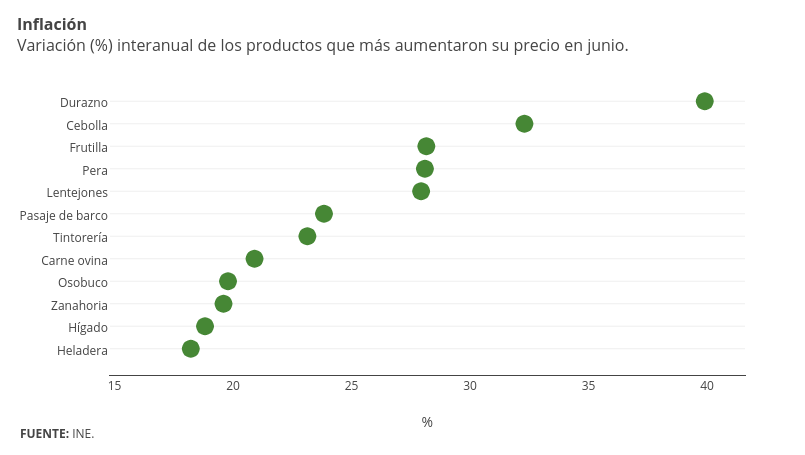
Emiliasalaverria's interactive graph and data of "Col1" is a scatter chart, showing Col1; with % in the x-axis. The x-axis shows values from 14.8 to 41.59885245901639. The y-axis shows values from -1.1666666666666667 to 12.166666666666666. This visualization has the following annotations: InflaciónVariación (%) interanual de los productos que más aumentaron su precio en junio.; FUENTE: INE.