Edit chart
Loading graph
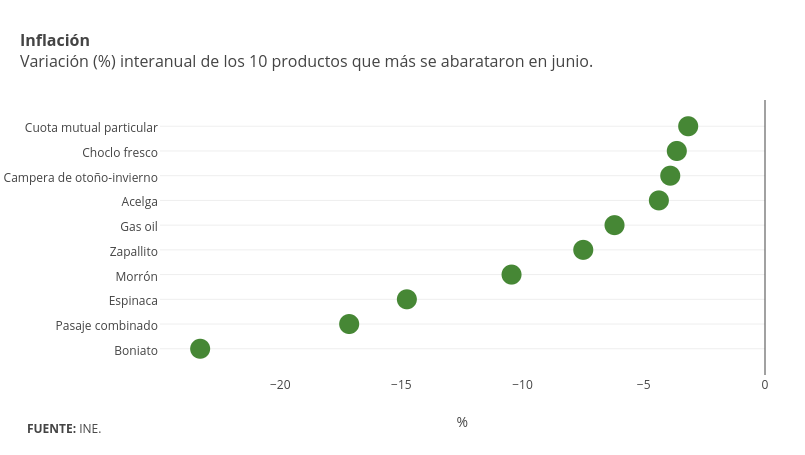
Emiliasalaverria's interactive graph and data of "Col1" is a scatter chart, showing Col1; with % in the x-axis. The x-axis shows values from -24.967333974975936 to 0. The y-axis shows values from -1.0617977528089888 to 10.061797752808989. This visualization has the following annotations: InflaciónVariación (%) interanual de los 10 productos que más se abarataron en junio.; FUENTE: INE.