Edit chart
Loading graph
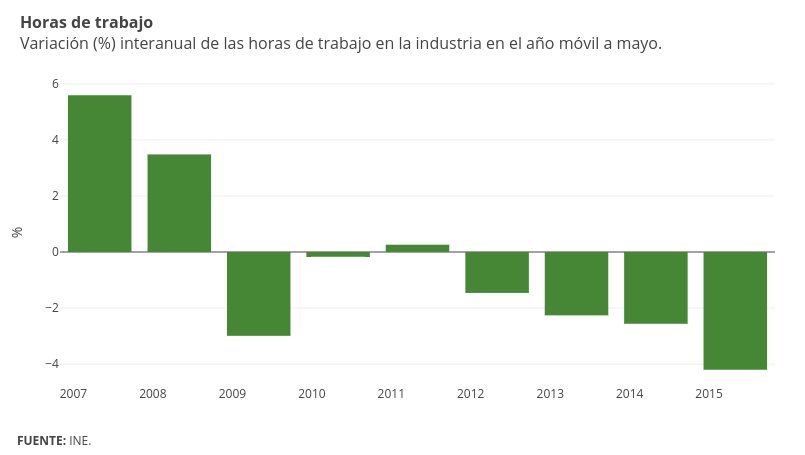
Emiliasalaverria's interactive graph and data of "% vs time" is a bar chart, showing Col2; with time in the x-axis and % in the y-axis.. The x-axis shows values from 1162220400000 to 1446217200000. The y-axis shows values from -4.743888888888889 to 6.1338888888888885. This visualization has the following annotations: Horas de trabajo Variación (%) interanual de las horas de trabajo en la industria en el año móvil a mayo.; FUENTE: INE.