Edit chart
Loading graph
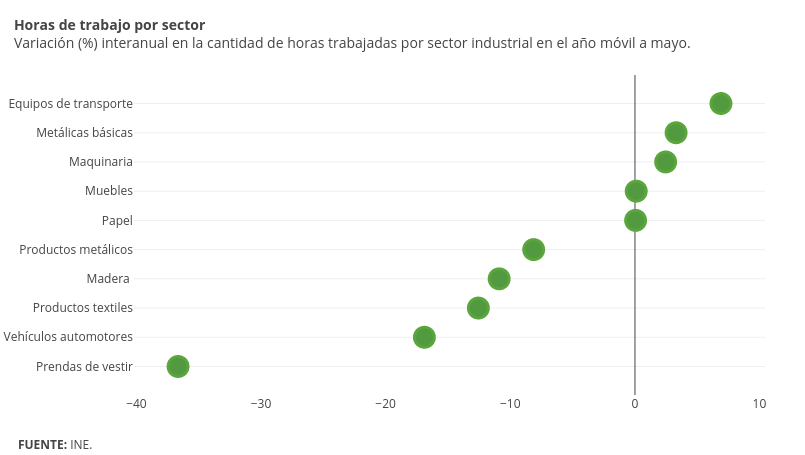
Emiliasalaverria's interactive graph and data of "Col1" is a scatter chart, showing Col1. The x-axis shows values from -40.20519708970345 to 10.435197089703443. The y-axis shows values from -0.9752851711026617 to 9.975285171102662. This visualization has the following annotations: Horas de trabajo por sector Variación (%) interanual en la cantidad de horas trabajadas por sector industrial en el año móvil a mayo.; FUENTE: INE.