Edit chart
Loading graph
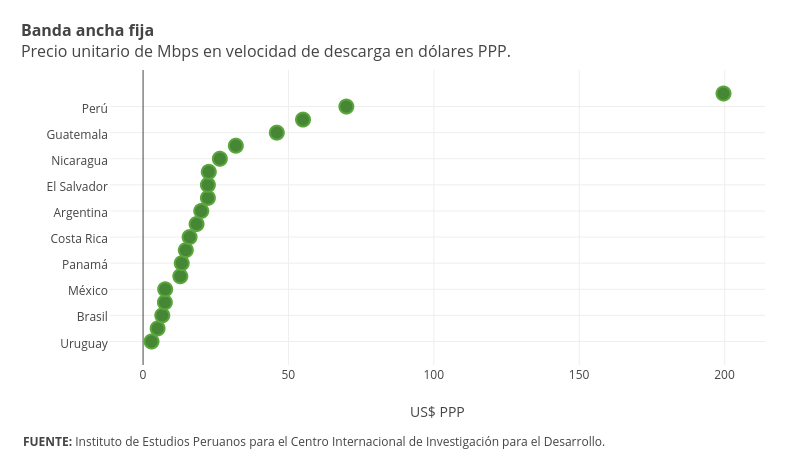
Emiliasalaverria's interactive graph and data of "Col1" is a scatter chart, showing Col1; with US$ PPP in the x-axis. The x-axis shows values from -11.371066433566433 to 213.87106643356643. The y-axis shows values from -1.8004032258064517 to 20.800403225806452. This visualization has the following annotations: Banda ancha fija Precio unitario de Mbps en velocidad de descarga en dólares PPP.; FUENTE: Instituto de Estudios Peruanos para el Centro Internacional de Investigación para el Desarrollo.