Edit chart
Loading graph
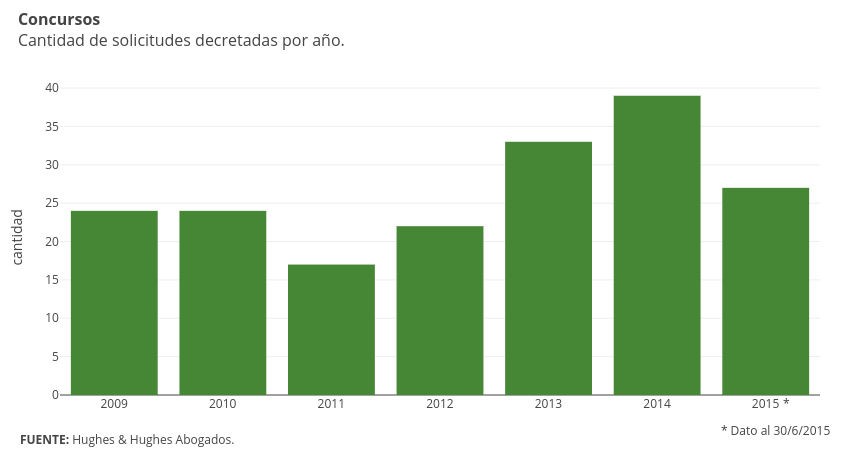
Emiliasalaverria's interactive graph and data of "Col2" is a bar chart, showing Col2; with cantidad in the y-axis. The x-axis shows values from 2008.5 to 2015.5. The y-axis shows values from 0 to 41.05263157894737. This visualization has the following annotations: Concursos Cantidad de solicitudes decretadas por año.; FUENTE: Hughes & Hughes Abogados.; *; * Dato al 30/6/2015