Edit chart
Loading graph
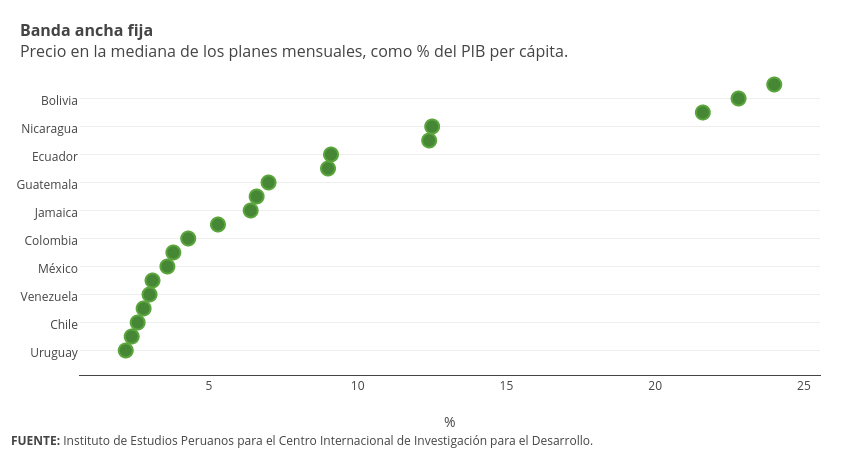
Emiliasalaverria's interactive graph and data of "Col1" is a scatter chart, showing Col1; with % in the x-axis. The x-axis shows values from 0.6620663068619892 to 25.53793369313801. The y-axis shows values from -1.75 to 20.75. This visualization has the following annotations: FUENTE: Instituto de Estudios Peruanos para el Centro Internacional de Investigación para el Desarrollo.; Banda ancha fija Precio en la mediana de los planes mensuales, como % del PIB per cápita.