Edit chart
Loading graph
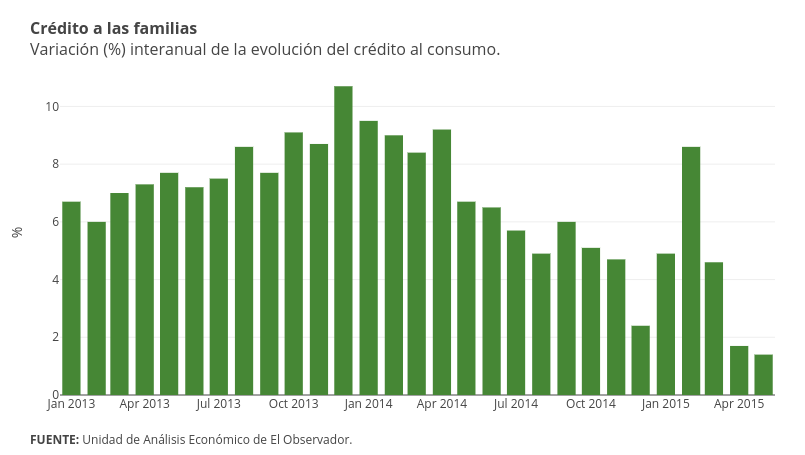
Emiliasalaverria's interactive graph and data of "% vs time" is a bar chart, showing Col2; with time in the x-axis and % in the y-axis.. The x-axis shows values from 1355796000000 to 1431658800000. The y-axis shows values from 0 to 11.26315789473684. This visualization has the following annotations: Crédito a las familiasVariación (%) interanual de la evolución del crédito al consumo.; FUENTE: Unidad de Análisis Económico de El Observador.