Edit chart
Loading graph
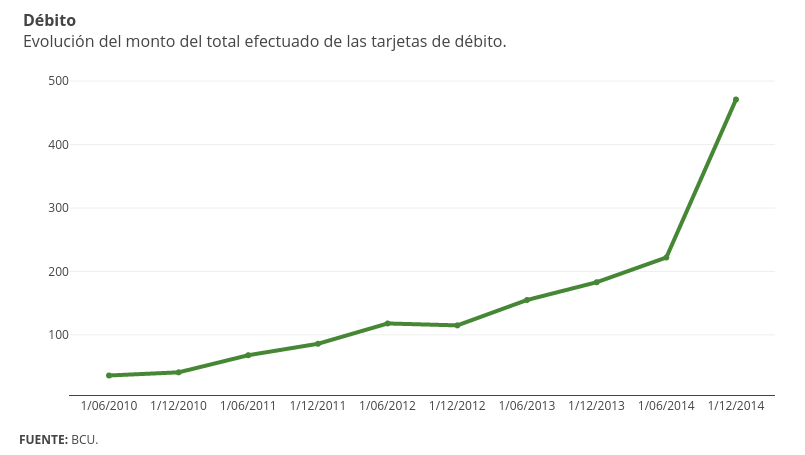
Emiliasalaverria's interactive graph and data of "Col2" is a scatter chart, showing Col2. The x-axis shows values from -0.5598086124401914 to 9.559808612440191. The y-axis shows values from 5.26630434782609 to 501.73369565217394. This visualization has the following annotations: DébitoEvolución del monto del total efectuado de las tarjetas de débito.; FUENTE: BCU.