Edit chart
Loading graph
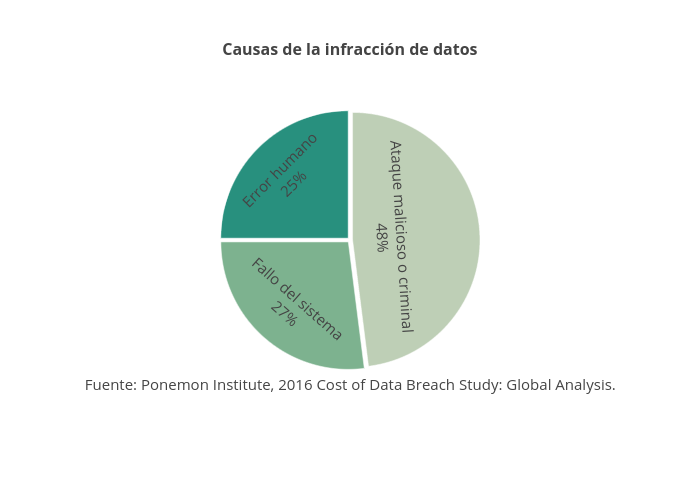
Emmamarzal's interactive graph and data of "Causas de la infracción de datos" is a pie, showing B. The x-axis shows values from 0 to 0. The y-axis shows values from 0 to 0. This visualization has the following annotation: Fuente: Ponemon Institute, 2016 Cost of Data Breach Study: Global Analysis.