Edit chart
Loading graph
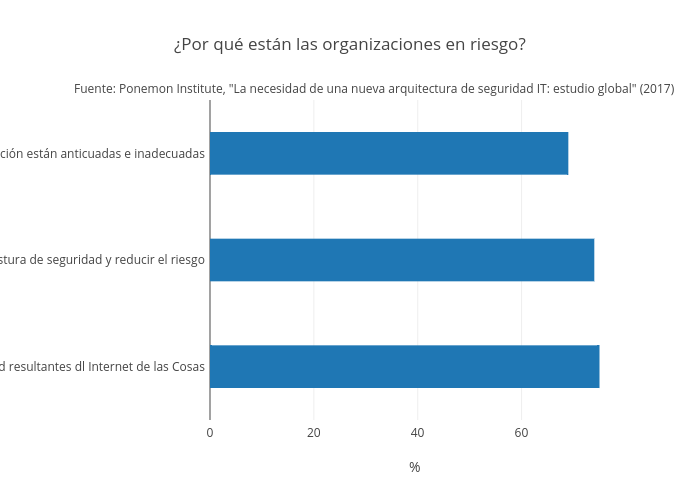
Emmamarzal's interactive graph and data of "¿Por qué están las organizaciones en riesgo?" is a bar chart, showing Framework; with % in the x-axis and in the y-axis.. The x-axis shows values from 0 to 78.94736842105263. The y-axis shows values from -0.5 to 2.5. This visualization has the following annotation: Fuente: Ponemon Institute, "La necesidad de una nueva arquitectura de seguridad IT: estudio global" (2017)