Edit chart
Loading graph
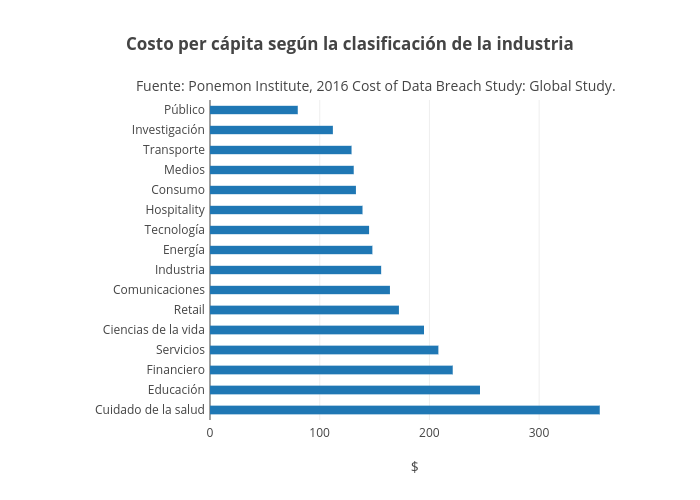
Emmamarzal's interactive graph and data of "Costo per cápita según la clasificación de la industria" is a bar chart, showing Framework; with $ in the x-axis. The x-axis shows values from 0 to 373.6842105263158. The y-axis shows values from -0.5 to 15.5. This visualization has the following annotation: Fuente: Ponemon Institute, 2016 Cost of Data Breach Study: Global Study.