Edit chart
Loading graph
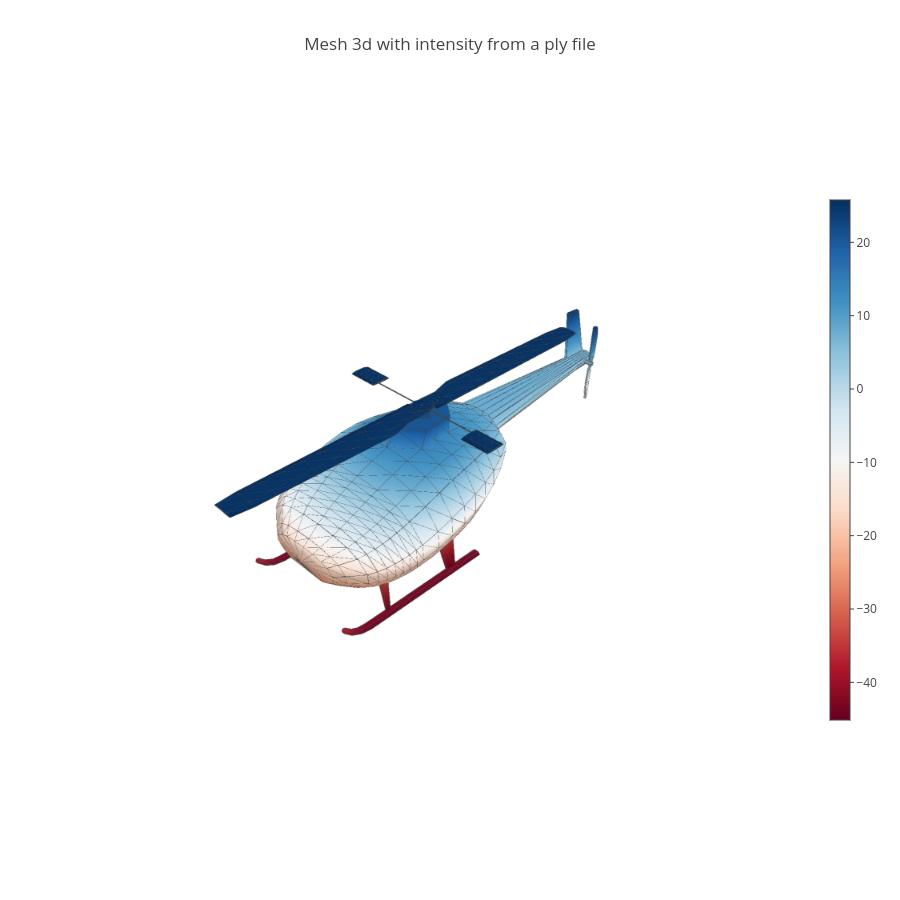
Empet's interactive graph and data of "Mesh 3d with intensity from a ply file " is a mesh3d, showing vs . The x-axis shows values from 0 to 0. The y-axis shows values from 0 to 0.