Edit chart
Loading graph
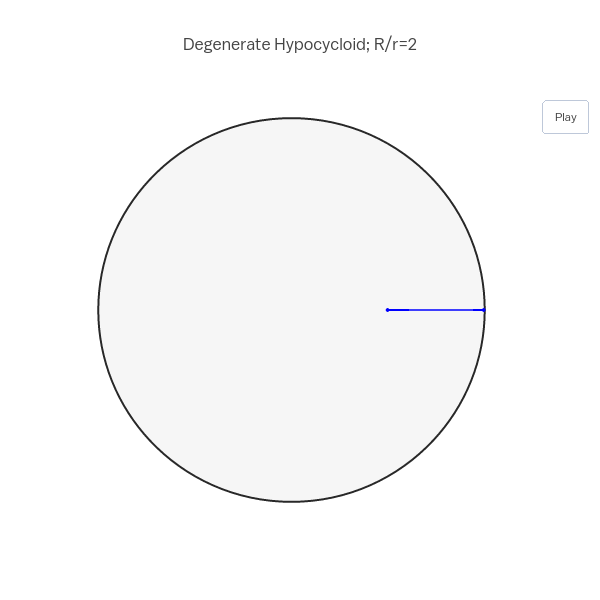
Empet's interactive graph and data of "Degenerate Hypocycloid; R/r=2" is a scatter chart, showing , , . The x-axis shows values from -1.1 to 1.1. The y-axis shows values from -1.1 to 1.1.