Edit chart
Loading graph
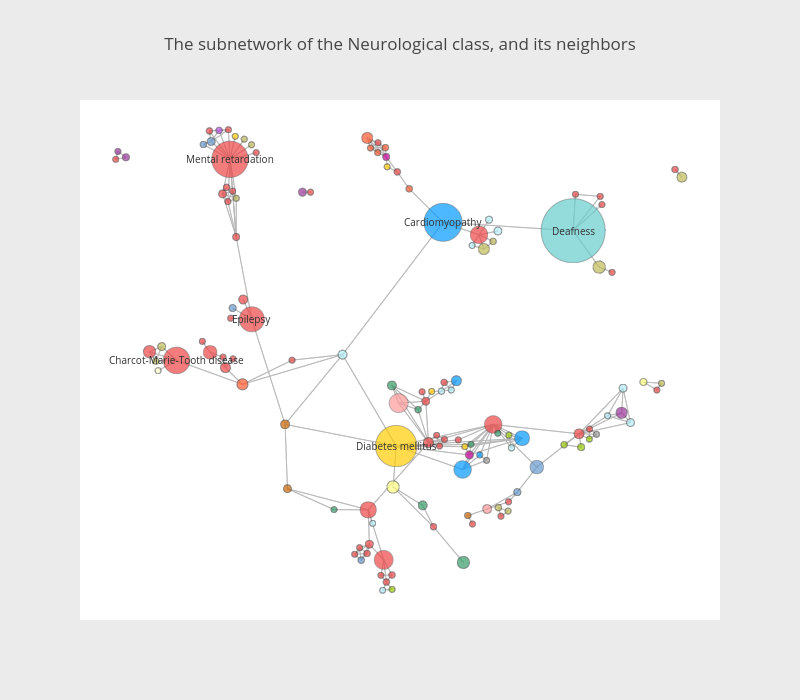
Empet's interactive graph and data of "The subnetwork of the Neurological class, and its neighbors" is a line chart. The x-axis shows values from 0 to 0. The y-axis shows values from 0 to 0. This visualization has the following annotations: Cardiomyopathy; Deafness; Mental retardation; Diabetes mellitus; Epilepsy; Charcot-Marie-Tooth disease