Edit chart
Loading graph
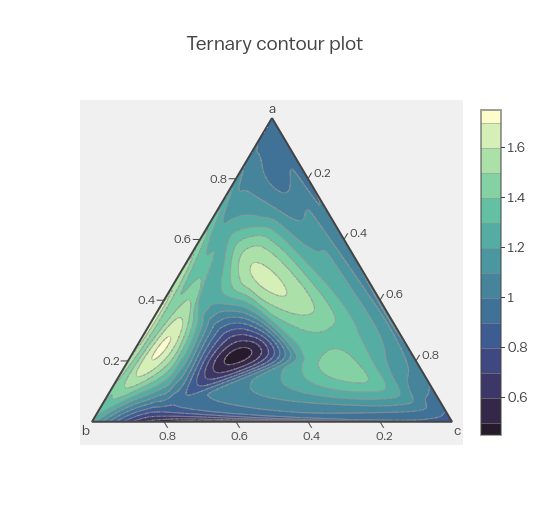
Empet's interactive graph and data of "Ternary contour plot" is a contour. The x-axis shows values from 0 to 0. The y-axis shows values from 0 to 0. This visualization has the following annotations: a; b; c; 0.8; 0.6; 0.4; 0.2; 0.8; 0.6; 0.4; 0.2; 0.8; 0.6; 0.4; 0.2