Edit chart
Loading graph
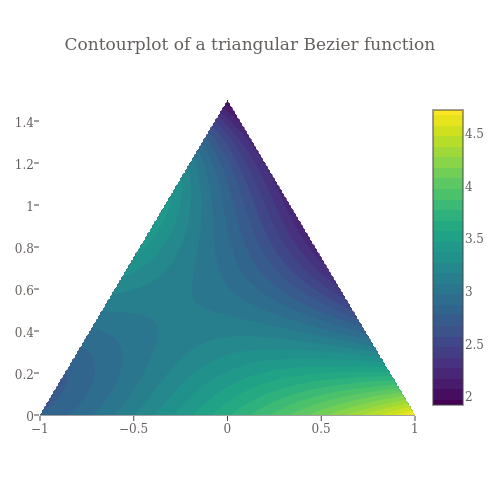
Empet's interactive graph and data of "Contourplot of a triangular Bezier function" is a contour. The x-axis shows values from -1.0 to 1.0. The y-axis shows values from 0.0 to 1.5.