Edit chart
Loading graph
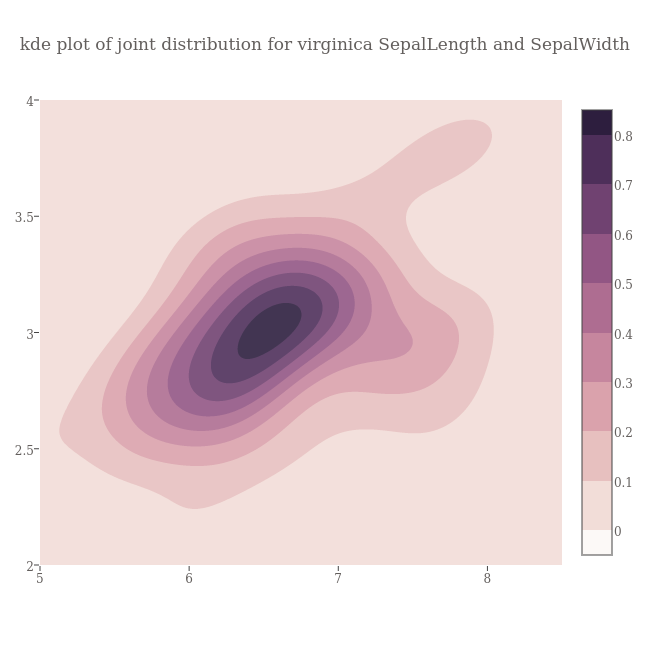
Empet's interactive graph and data of "kde plot of joint distribution for virginica SepalLength and SepalWidth" is a contour. The x-axis shows values from 5 to 8.5. The y-axis shows values from 2 to 4.