Edit chart
Loading graph
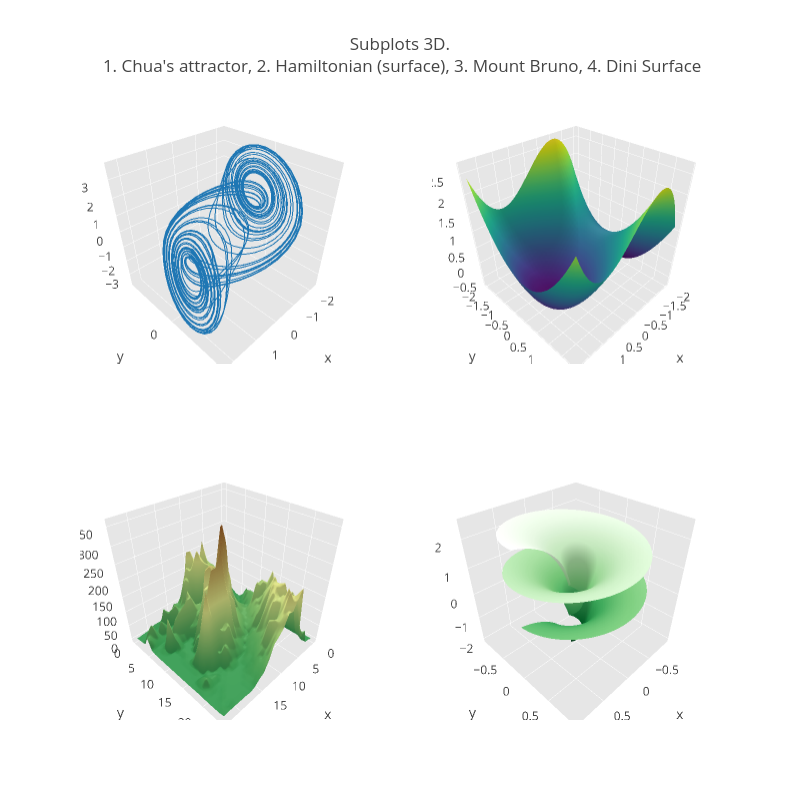
Empet's interactive graph and data of "Subplots 3D. 1. Chua's attractor, 2. Hamiltonian (surface), 3. Mount Bruno, 4. Dini Surface" is a scatter3d, showing Trace 0, y, Trace 1, y, . The x-axis shows values from 0 to 0. The y-axis shows values from 0 to 0.