Edit chart
Loading graph
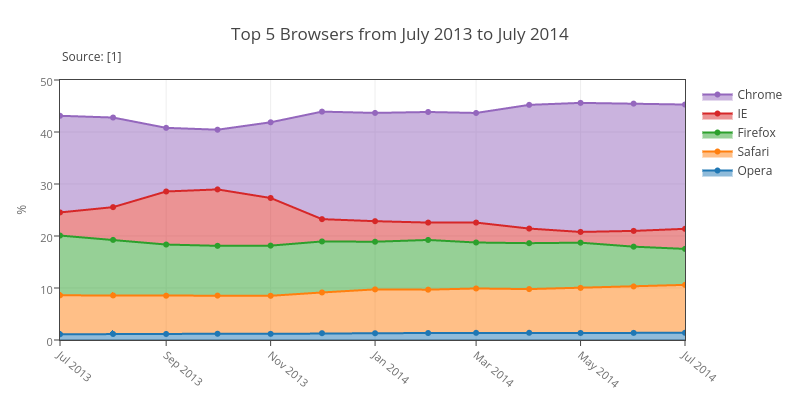
Empet's interactive graph and data of "Top 5 Browsers from July 2013 to July 2014" is a filled scatter chart, showing Opera, Safari, Firefox, IE, Chrome; with % in the y-axis. The x-axis shows values from 0 to 0. The y-axis shows values from 0 to 50. This visualization has the following annotation: Source: [1]