Edit chart
Loading graph
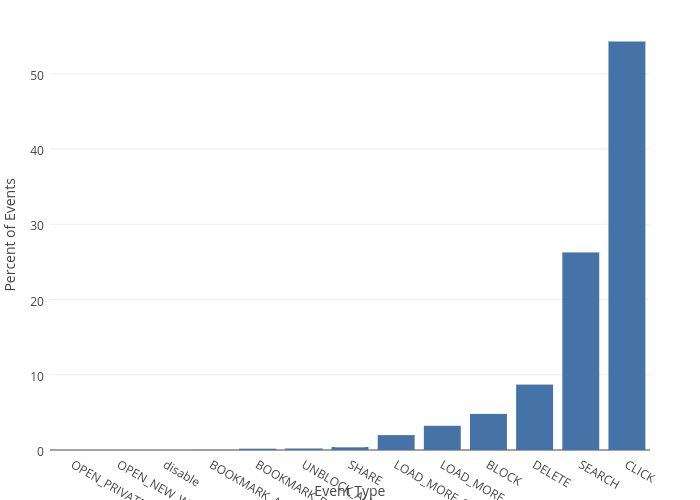
Emtwo's interactive graph and data of "Percent of Events vs Event Type" is a bar chart, showing percent_tot; with Event Type in the x-axis and Percent of Events in the y-axis.. The x-axis shows values from -0.5 to 12.5. The y-axis shows values from 0 to 57.1558281966941.