Edit chart
Loading graph
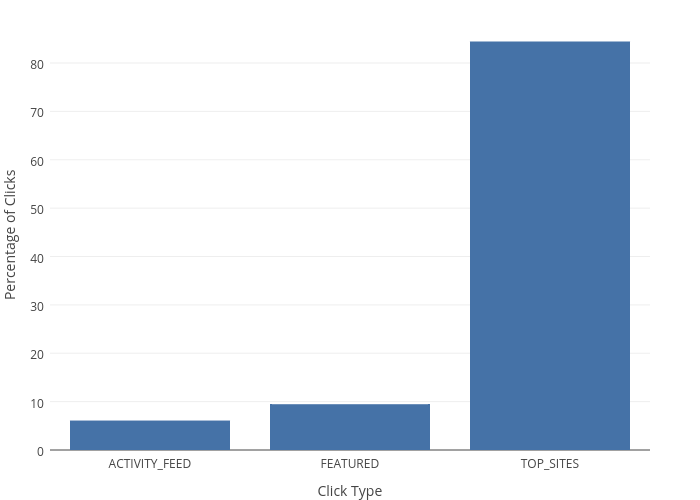
Emtwo's interactive graph and data of "Percentage of Clicks vs Click Type" is a bar chart, showing percent_clicks; with Click Type in the x-axis and Percentage of Clicks in the y-axis.. The x-axis shows values from -0.5 to 2.5. The y-axis shows values from 0 to 88.8892441779359.