Edit chart
Loading graph
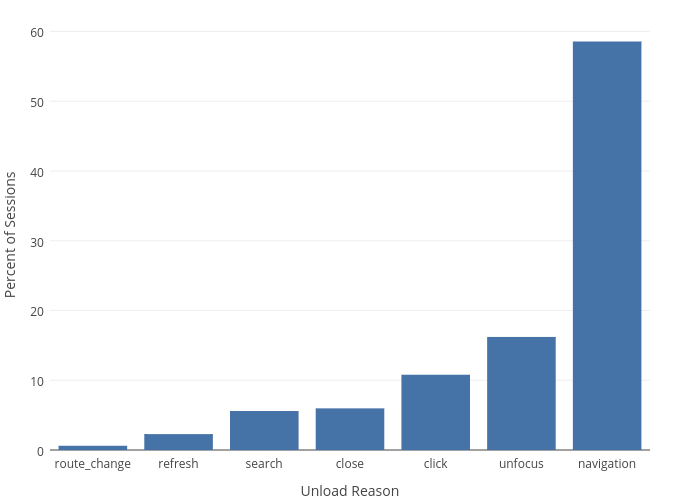
Emtwo's interactive graph and data of "Percent of Sessions vs Unload Reason" is a bar chart, showing percent_sessions; with Unload Reason in the x-axis and Percent of Sessions in the y-axis.. The x-axis shows values from -0.5 to 6.5. The y-axis shows values from 0 to 61.64492666527063.