Edit chart
Loading graph
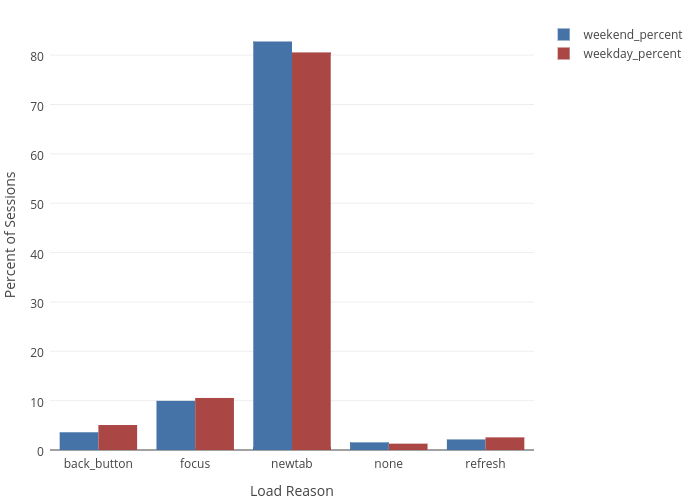
Emtwo's interactive graph and data of "Percent of Sessions vs Load Reason" is a bar chart, showing weekend_percent vs weekday_percent; with Load Reason in the x-axis and Percent of Sessions in the y-axis.. The x-axis shows values from -0.5 to 4.5. The y-axis shows values from 0 to 87.11900411542126.