Edit chart
Loading graph
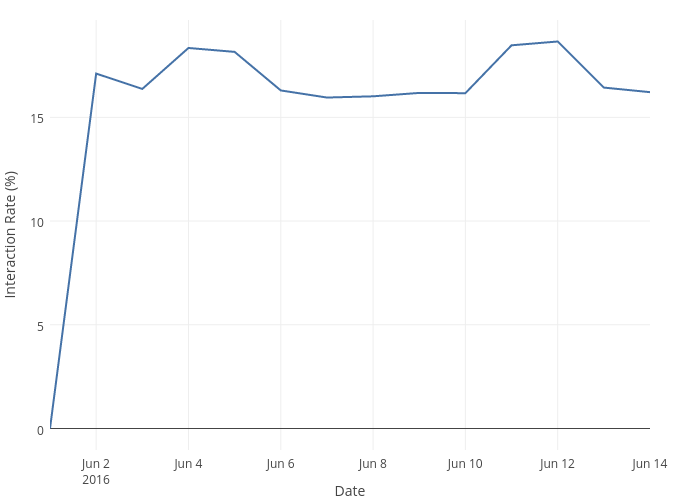
Emtwo's interactive graph and data of "Interaction Rate (%) vs Date" is a scatter chart, showing click_through_rate; with Date in the x-axis and Interaction Rate (%) in the y-axis.. The x-axis shows values from 1464735600000 to 1465858800000. The y-axis shows values from -1.0364825829639057 to 19.693169076314206.