Edit chart
Loading graph
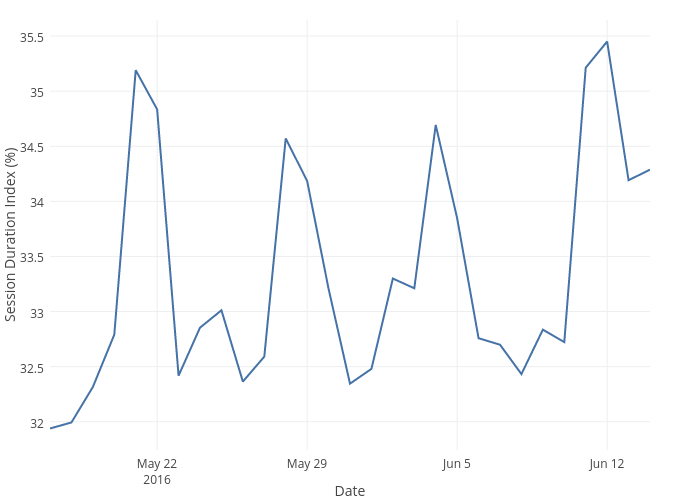
Emtwo's interactive graph and data of "Session Duration Index (%) vs Date" is a scatter chart, showing percentage; with Date in the x-axis and Session Duration Index (%) in the y-axis.. The x-axis shows values from 1463439600000 to 1465858800000. The y-axis shows values from 31.743336078505063 to 35.64615424442984.