Edit chart
Loading graph
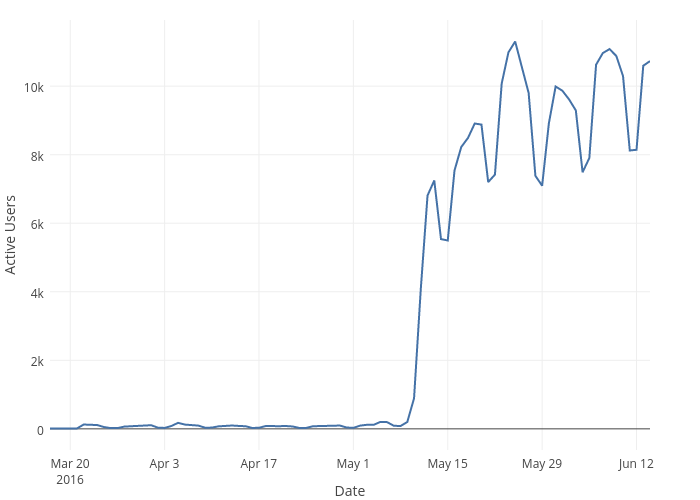
Emtwo's interactive graph and data of "Active Users vs Date" is a scatter chart, showing dau; with Date in the x-axis and Active Users in the y-axis.. The x-axis shows values from 1458172800000 to 1465858800000. The y-axis shows values from -617.4444444444446 to 11931.444444444445.