Edit chart
Loading graph
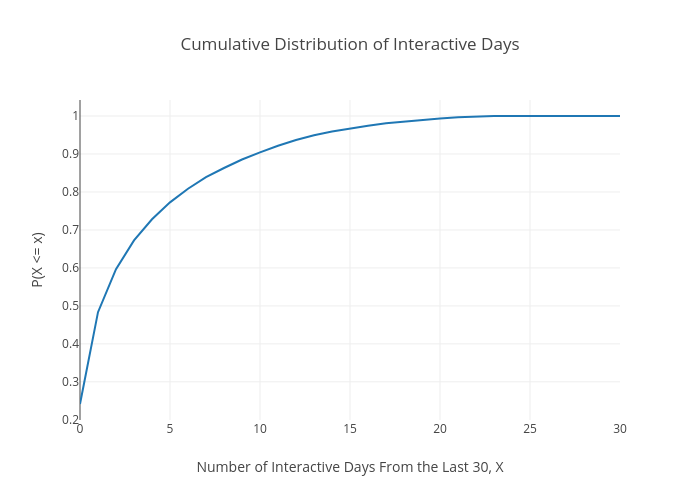
Emtwo's interactive graph and data of "Cumulative Distribution of Interactive Days" is a scatter chart, showing y; with Number of Interactive Days From the Last 30, X in the x-axis and P(X <= x) in the y-axis.. The x-axis shows values from 0 to 30. The y-axis shows values from 0.19949432294804995 to 1.0421318777395763.