Edit chart
Loading graph
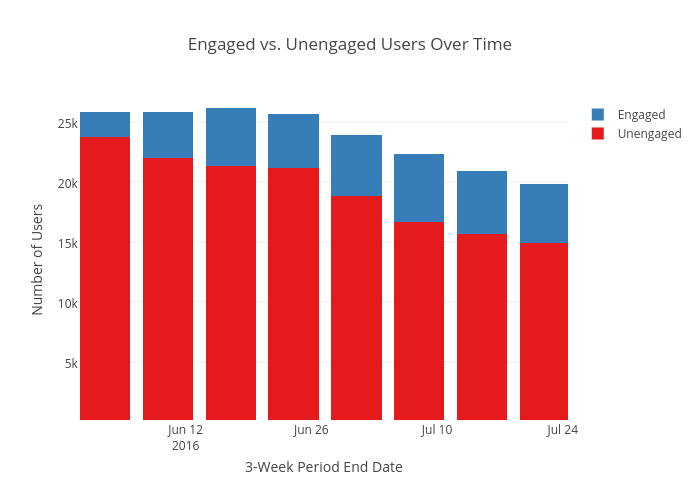
Emtwo's interactive graph and data of "Engaged vs. Unengaged Users Over Time" is a stacked bar chart, showing Unengaged vs Engaged; with 3-Week Period End Date in the x-axis and Number of Users in the y-axis.. The x-axis shows values from 1464672064731.641 to 1469367468401.162. The y-axis shows values from 141.22815495332998 to 26814.179024937745.