Edit chart
Loading graph
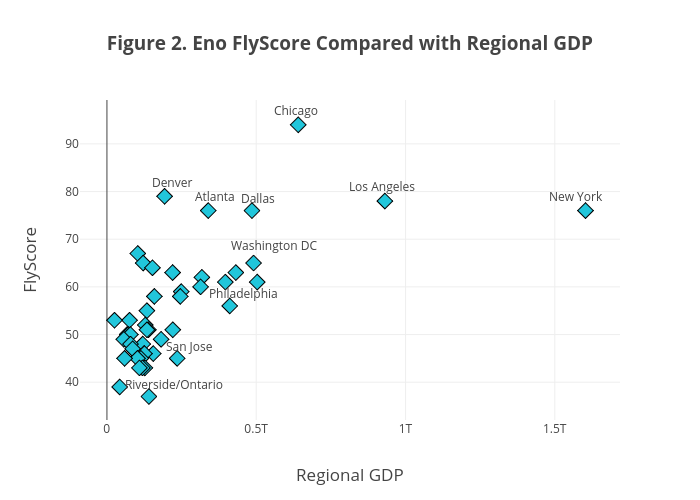
Enotrans's interactive graph and data of "Figure 2. Eno FlyScore Compared with Regional GDP" is a scatter chart, showing Column 4; with Regional GDP in the x-axis and FlyScore in the y-axis.. The x-axis shows values from -79436438919.34222 to 1707491438919.3423. The y-axis shows values from 32.43087846303773 to 98.75414172351385. This visualization has the following annotations: Chicago; Denver; Los Angeles; New York; Atlanta; Dallas; Riverside/Ontario; San Jose; Philadelphia; Washington DC