Edit chart
Loading graph
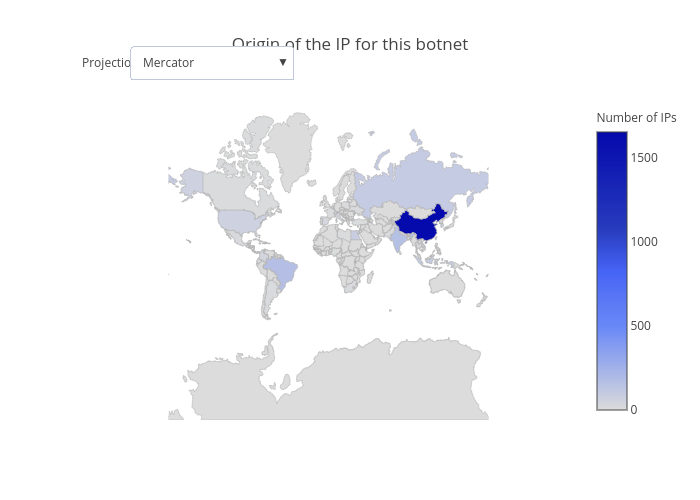
Equalitie's interactive graph and data of "Origin of the IP for this botnet" is a choropleth. The x-axis shows values from 0 to 0. The y-axis shows values from 0 to 0. This visualization has the following annotation: Projection: