Edit chart
Loading graph
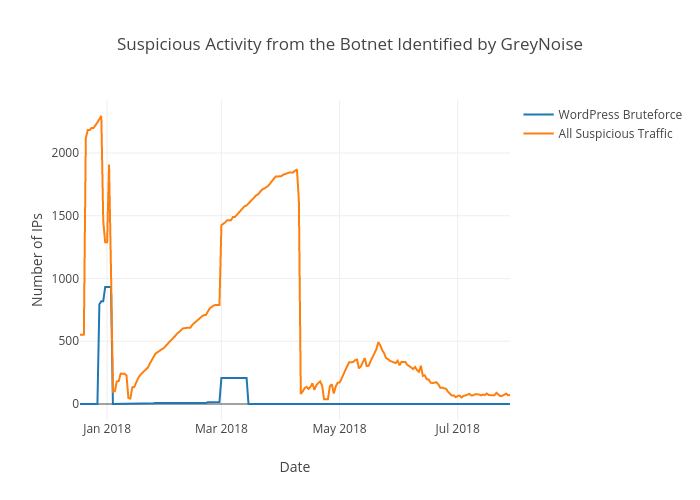
Equalitie's interactive graph and data of "Suspicious Activity from the Botnet Identified by GreyNoise" is a scatter chart, showing WordPress Bruteforce vs All Suspicious Traffic; with Date in the x-axis and Number of IPs in the y-axis.. The x-axis shows values from 0 to 0. The y-axis shows values from 0 to 0.