Edit chart
Loading graph
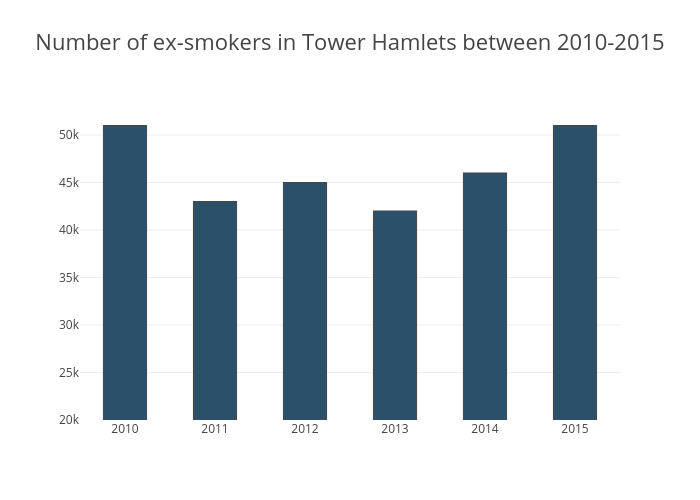
Erenatakadrolli's interactive graph and data of "Number of ex-smokers in Tower Hamlets between 2010-2015" is a bar chart, showing B; with in the x-axis and in the y-axis.. The x-axis shows values from 2009.5 to 2015.5. The y-axis shows values from 20000 to 53684.21052631579.