Edit chart
Loading graph
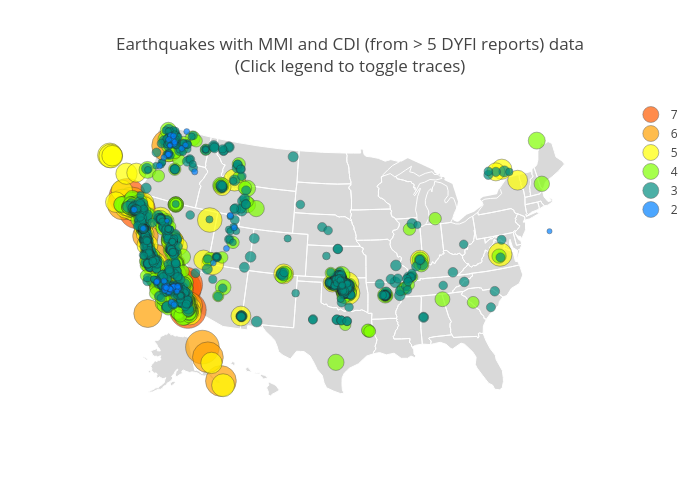
Erhepp's interactive graph and data of "Earthquakes with MMI and CDI (from > 5 DYFI reports) data(Click legend to toggle traces)" is a scattergeo, showing 8, 7, 6, 5, 4, 3, 2. The x-axis shows values from 0 to 0. The y-axis shows values from 0 to 0.