Edit chart
Loading graph
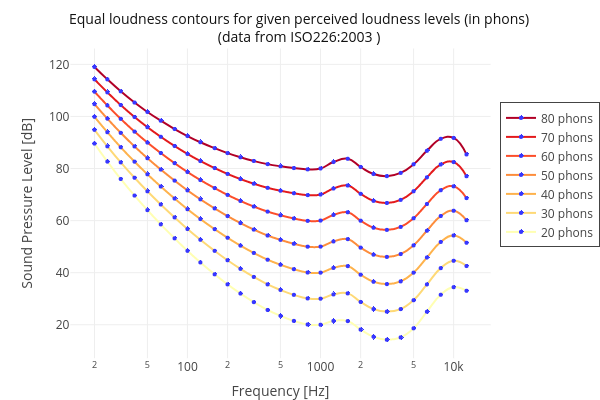
Eric.marty's interactive graph and data of "Equal loudness contours for different loudness levels (in phons)" is a line chart, showing 20 phons, 30 phons, 40 phons, 50 phons, 60 phons, 70 phons, 80 phons; with Frequency [Hz] in the x-axis and Sound Pressure Level [dB] in the y-axis.. The x-axis shows values from 1.120700544455779 to 4.277239464216258. The y-axis shows values from 7.157267499596671 to 126.08864350040332. This visualization has the following annotation: Equal loudness contours for given perceived loudness levels (in phons)(data from ISO226:2003 )