Edit chart
Loading graph
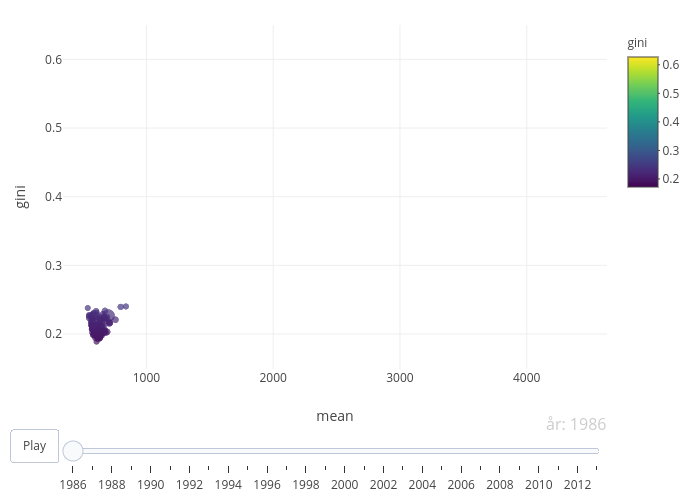
Erlinglundevaller's interactive graph and data of "gini vs mean" is a scatter chart; with mean in the x-axis and gini in the y-axis.. The x-axis shows values from 341.658091042699 to 4633.24362544773. The y-axis shows values from 0.149061674906682 to 0.650028449242628.