Edit chart
Loading graph
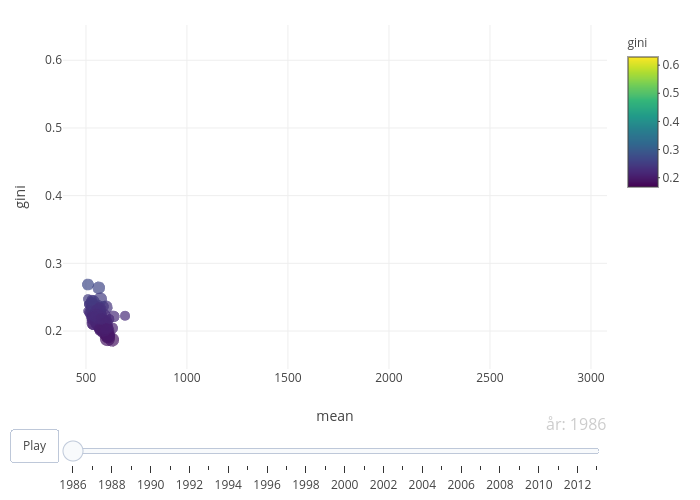
Erlinglundevaller's interactive graph and data of "gini vs mean" is a scatter chart; with mean in the x-axis and gini in the y-axis.. The x-axis shows values from 386.481044464206 to 3079.40473291833. The y-axis shows values from 0.14386952760455 to 0.652053026284201.