Edit chart
Loading graph
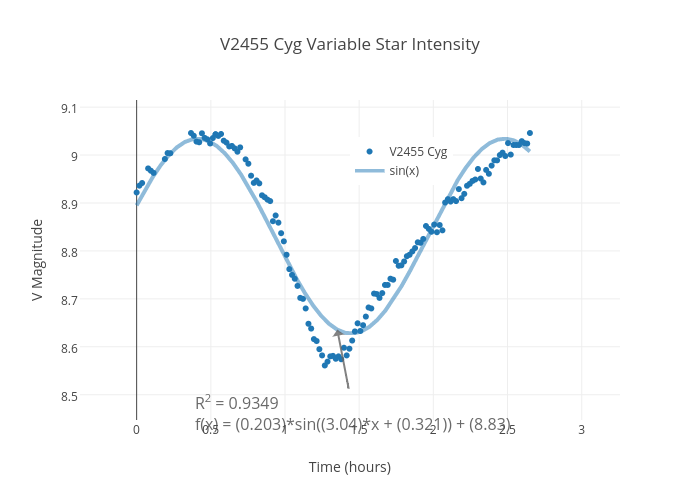
Erollin's interactive graph and data of "V2455 Cyg Variable Star Intensity" is a scatter chart, showing V2455 Cyg vs sin(x); with Time (hours) in the x-axis and V Magnitude in the y-axis.. The x-axis shows values from -0.3817671015050994 to 3.258055382699194. The y-axis shows values from 8.447233417488603 to 9.11489613278881. This visualization has the following annotation: R2 = 0.9349f(x) = (0.203)*sin((3.04)*x + (0.321)) + (8.83)