Edit chart
Loading graph
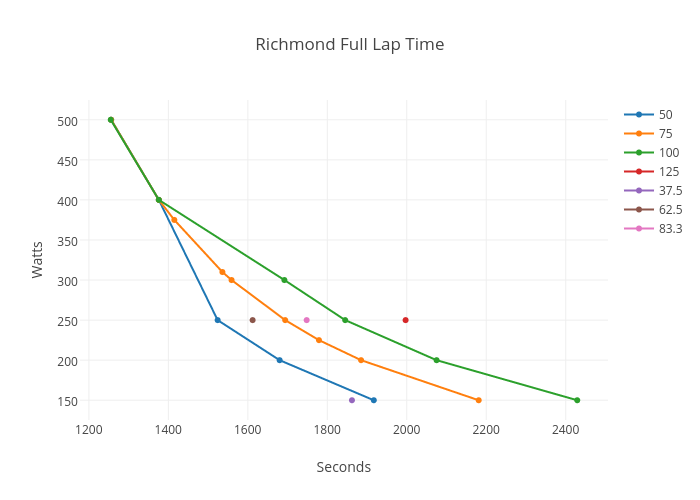
Eschlange's interactive graph and data of "Richmond Full Lap Time" is a scatter chart, showing 50, 75, 100, 125, 37.5, 62.5, 83.3; with Seconds in the x-axis and Watts in the y-axis.. The x-axis shows values from 1181.9013115179846 to 2502.0986884820154. The y-axis shows values from 127.53623188405797 to 522.463768115942.